NetTalk Central

Author Topic: data on a map?  (Read 2845 times)

Jane

  • Sr. Member
  • ****
  • Posts: 363
  • Expert on nothing with opinions on everything.
    • View Profile
    • Email
data on a map?
« on: June 26, 2020, 10:14:41 AM »
I have no idea where to start with something like this.

The concept would be a page displaying a map showing two counties, with some kind of graphic (different size dots?) showing COVID cases in each postal code.

The underlying map could be a static graphic, rather than an actual map from a service.

Any thoughts or examples?

TIA,

Jane

Alberto

  • Hero Member
  • *****
  • Posts: 1860
    • MSN Messenger - alberto-michelis@hotmail.com
    • View Profile
    • ARMi software solutions
    • Email
Re: data on a map?
« Reply #1 on: June 26, 2020, 11:24:31 AM »
Hi Jane, you can do it both ways.
1- using a fix pic, you only need to know lat/lon of each corner and lat/lon of each ZIP code, then you can calculate the position of each ZIP icon(png) to draw it over the map.
2- use the NT map example using the Esri Maps and creating the waypoint (ZIP lat/lon) each one with a different icon(png)
I think you can start with example 76.
Cheers
-----------
Regards
Alberto

Jane

  • Sr. Member
  • ****
  • Posts: 363
  • Expert on nothing with opinions on everything.
    • View Profile
    • Email
Re: data on a map?
« Reply #2 on: June 26, 2020, 01:39:43 PM »
Thanks, Alberto.

I guess I would define some custom markers (representing various number ranges), set those to fixed locations, and select the appropriate marker based on the data point for that location.

I'll play with it....

Cheers,

Jane

rjolda

  • Sr. Member
  • ****
  • Posts: 290
    • View Profile
    • Email
Re: data on a map?
« Reply #3 on: June 28, 2020, 03:36:50 AM »
Hi Jane,
Two questions:
1. Where are you going to get the granularity of data of covid positive patients and their zip code?
2. Are you going to be developing an app to track positive cases?
Ron Jolda

Jane

  • Sr. Member
  • ****
  • Posts: 363
  • Expert on nothing with opinions on everything.
    • View Profile
    • Email
Re: data on a map?
« Reply #4 on: June 28, 2020, 09:42:17 AM »
Hi, Ron,

This is intended for internal use at a group of medical centers where I contract... based on their own lab interfaces.

And no, not an app - just display.

So... "right tool for the job" I think is either SQL Reporting Services or Power BI, rather than bashing something together with NT.

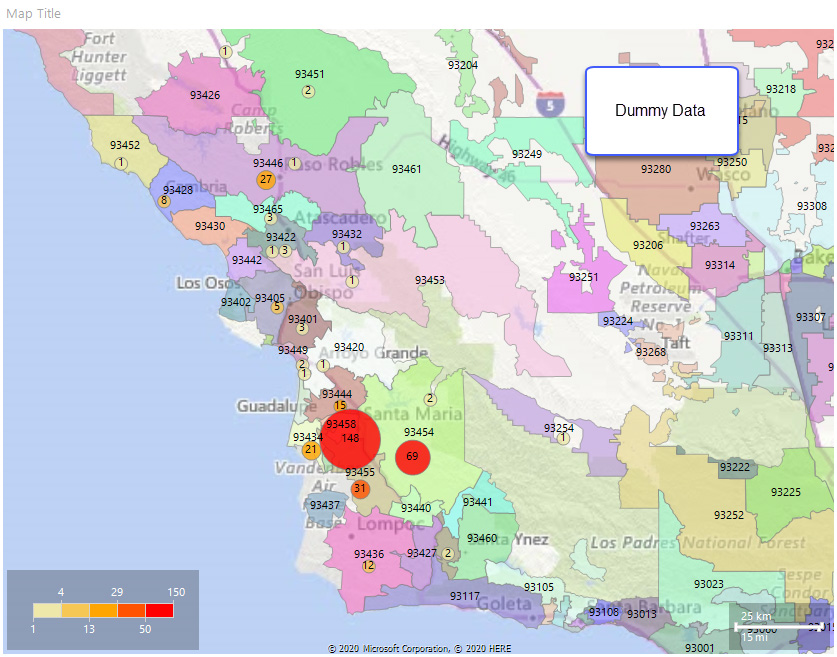
It was a challenge to get postal code shape files smaller than 800MB, but I found some and dummied up an SSRS map as a proof of concept.  If they think this works, I can attach it to real data.

Thanks for the response.

Jane


rjolda

  • Sr. Member
  • ****
  • Posts: 290
    • View Profile
    • Email
Re: data on a map?
« Reply #5 on: June 28, 2020, 10:04:01 AM »
Hi Jane,
I thought that it would be based on internal data.
I would love to see the 1st derivative on each zip code each day  or week.   Not sure what it would indicate but it would be fascinating to watch.
Might be able to develop some sort of predictive model.... or call in patients with under reported zip codes to test them ...
Ron Jolda